If You Believe in Predictive Modeling

By Lawrence C. Henze, J.D., Principal Consultant, Target Analytics, Blackbaud
Sorcery, black magic, supernatural, paranormal, hoax, alien influence; these terms are but a smattering of ‘explanations’ given over the centuries of humankind for mysterious phenomena that defy rational thought.
Until recently, using predictive modeling or statistical analytics to identify gift prospects also bordered on the inexplicable. For many, statistics or math are areas of study to be taken only as required. Over the years, my personal favorite is the use of the term ‘fairy dust’. Well thanks to J.M. Barrie, we all know that we only have to heed the advice of Peter Pan: “If you believe in fairies, clap your hands.” Of course, it also helps to see the power of predictive modeling in addressing the questions that lead to greater success in fundraising.
It is now evident that the nonprofit and higher education markets have applauded the application of predictive modeling and has accepted it as a scientific fact. The market for professionals with analytic skills is growing constantly, and you only have to attend APRA International or similar conferences to witness the increasing interest in the subject and its applications to fundraising.
So it may be a good time to review some of the fundamental, less technical aspects of predictive modeling to see if it is right for your organization.
How It Works
I first used a diluted form of predictive modeling in an attempt to identify the best annual fund prospects in a higher education database. Data was limited, and our techniques even less refined, but it helped us to focus our efforts on alumni more likely to give and/or upgrade, and most importantly it worked. I was hooked.
Later, in my time with Econometrics, Core Data and now Target Analytics, and under the development of top-notch statisticians, our techniques are continually developing and the accuracy of the analytics is steadily increasing. Yet the fundamental concepts remain the same:
1. Start with a fundraising question or issue, such as the identification of mid-level giving prospects (for example)
2. Collect the past and current data associated with mid-level giving, looking in particular at gifts of $1,000 and $9,999
3. Data of particular interest includes constituency codes, giving and/or membership history, participation in events, transactional and relationship data, etc.
4. Append data, which helps to create more robust modeling profiles through the use of financial and behavioral information
5. Divide the database into random halves, one for model building and the other for model testing
6. Create and test the model
7. Apply the validated model to the database through individual or household scores, and
8. Understand the implications of the model and implement appropriate strategies to grow your donor pool and gift revenue, as well as reduce expenditures on ineffective strategies. After all, if you do implement, why model?
And yes, I know it is a simple representation, but here is a diagram of the modeling process:

Lessons Learned
After 21+ years in analytics for nonprofit and higher education, I may assure you there are many lessons to be learned from experience. It is interesting to observe the number of fundraising axioms that have not survived under the scrutiny of actual giving data, as well as the new discoveries that have yielded a better understanding of the characteristics of donors and non-donors alike. A few of the most interesting lessons include:
1. There are many different views of giving history that are applicable to statistical analysis, all with varying degrees of utility depending on the question asked. In addition to actual giving, number of gifts, lifetime giving and average gift, useful data points are:
a. Velocity – a comparison of total giving in the most recent 12 months to the average giving over the three previous years (the recent gift is divided by the average, a score greater than 1 is considered positive velocity)
i. Positive velocity is not the only desirable result – constant or decreasing velocity may be positively correlated with planned giving behavior
b. Giving continuity or loyalty – although ‘consecutive years of giving’ is an important data point, if you focus on this and not overall loyalty as well and you are ignoring critical information. Most everyone agrees that a donor who gives 3 or 4 years out of 5 is a loyal contributor, and years of giving analysis indicates they tend to perform in the long-term similarly to supporters who give annually.
c. Data that is too good to be true – Always remember that correlation does not equal causality. If you build models on your own, and those models include data points such as ‘presence of an email’ or ‘presence of a business address’ you should question if there is actual causality. And it is most likely there is not. These data points are far more likely to be present for donors than non-donors, and may be captured through the giving process itself, creating a surrogate for giving behavior.
d. Bias – Let’s say 3% of your database is rated as major gift prospects. You host a cultivation event, inviting only those people rated as major gift prospects. Two years later you build a major gift model, and attendance at that event is highly correlated. Although you may confirm the importance of the event itself – and that is beneficial – since you eliminated 97% of the database from the invitation process, you may have created a skewed result that is not applicable to the entire database.
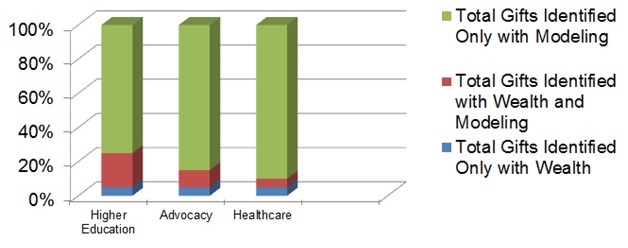
e. Wealth data – I saved one of the first lessons for last. For decades, wealth information drove the prospect research function. As predictive modeling grew in acceptance, more and more professionals realized that wealth data is one potential part of an equation or algorithm to predict giving behavior. In fact, we know that an individual’s likelihood to contribute is more predictive of future giving than is their capacity to give. Do not conduct a wealth screening first and then model, as that creates bias in the modeling sample. Years of experience suggest that the best action plan is to create predictive models first, and then append wealth and hard asset data to those identified as top prospects through the analytical process. The following graph underscores the point that modeling alone is many times more predictive than wealth data.
What More Needs to Be Said?
In a future blog, I will address the critical question: “Now that the analysis is done, what do I do to make sure that results are implemented?”


Lawrence,
Can you clarify your last graph? Are these gifts that were predicted prior to being received? Does it tell us that Modeling alone is better or does it tell us that Higher Education organizations have larger budgets and so tend to pair Modeling and Wealth data in their prospecting work? Perhaps this communicates that modeling tends to be done across the entire donor database (thus every gift received is “predicted”) while a much smaller slice of the database typically receives wealth information (or wealth information alone)?